- Overview shows one row per account instead of side-by-side columns
- Figures in different currencies are kept apart: there is no single blended total
- This post is also a reading guide: what each card on Overview means, top to bottom
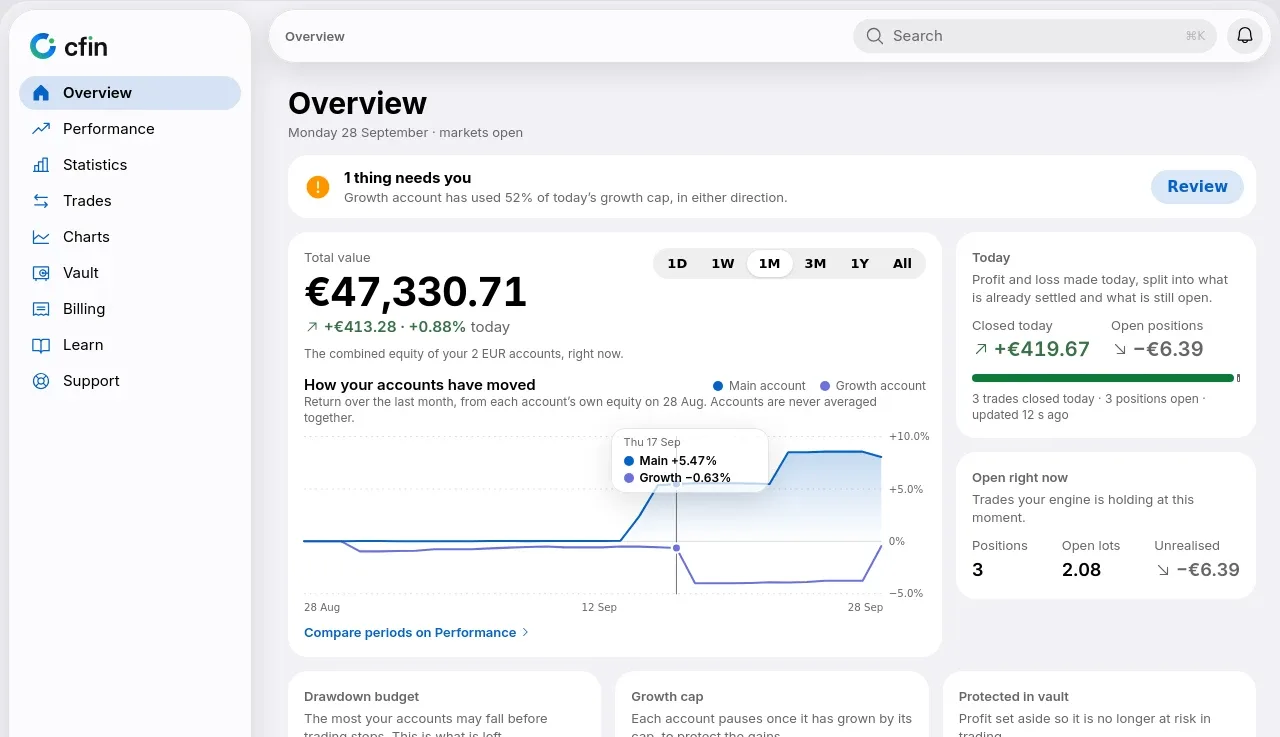
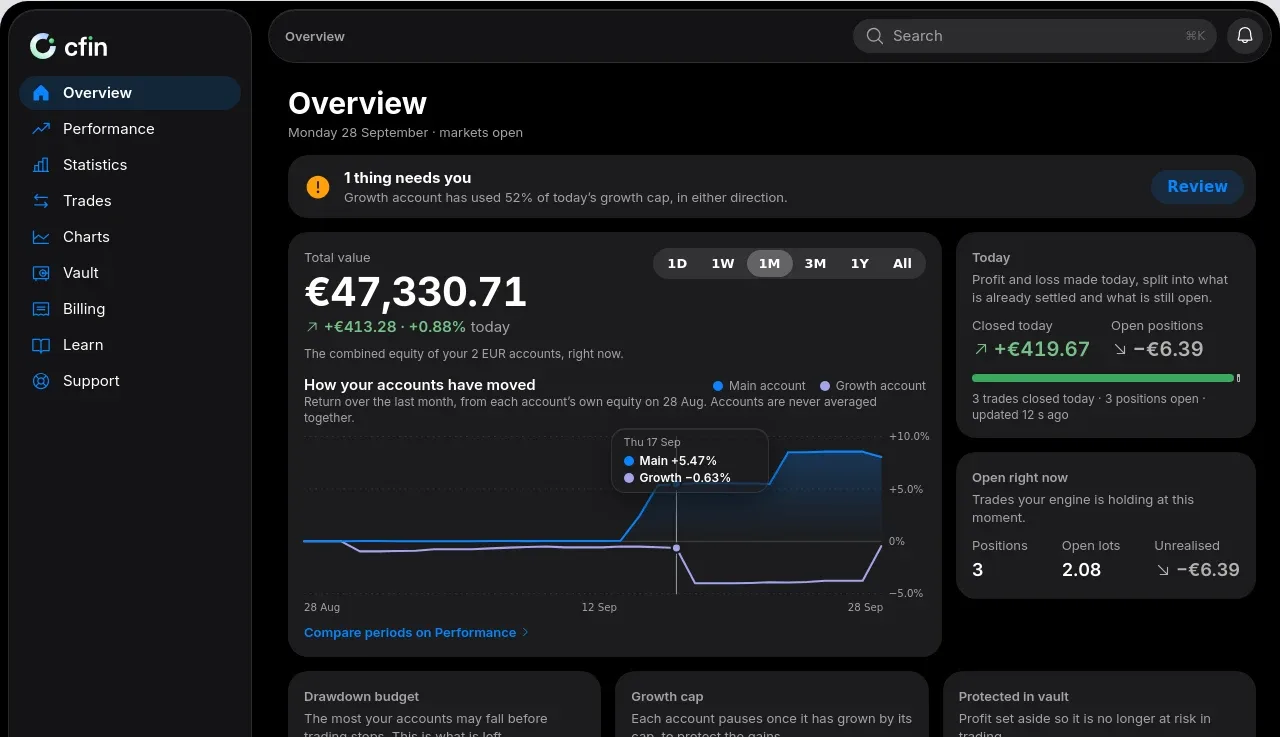
Overview is the page that shows your accounts at a glance. It now lists each account as its own row instead of side-by-side columns, because columns stopped working once customers held several accounts, especially on a phone. The page then reads top to bottom, from the value of your accounts right now to what happened this week. This post covers both the change and how to read each card.
What changed
Each account is a row, with a short detail view you can open or close for that account. The first few accounts carry a colour so you can follow them across the page; the rest are identified by name. "This week" shows a plain currency amount per day, summed only within a single currency. We never mix or average figures across different currencies or accounts, because that would produce a number that looks precise and describes nothing. The older "Overview (previous version)" page is retired, and its link now redirects here.




How to read Overview, top to bottom
Value right now
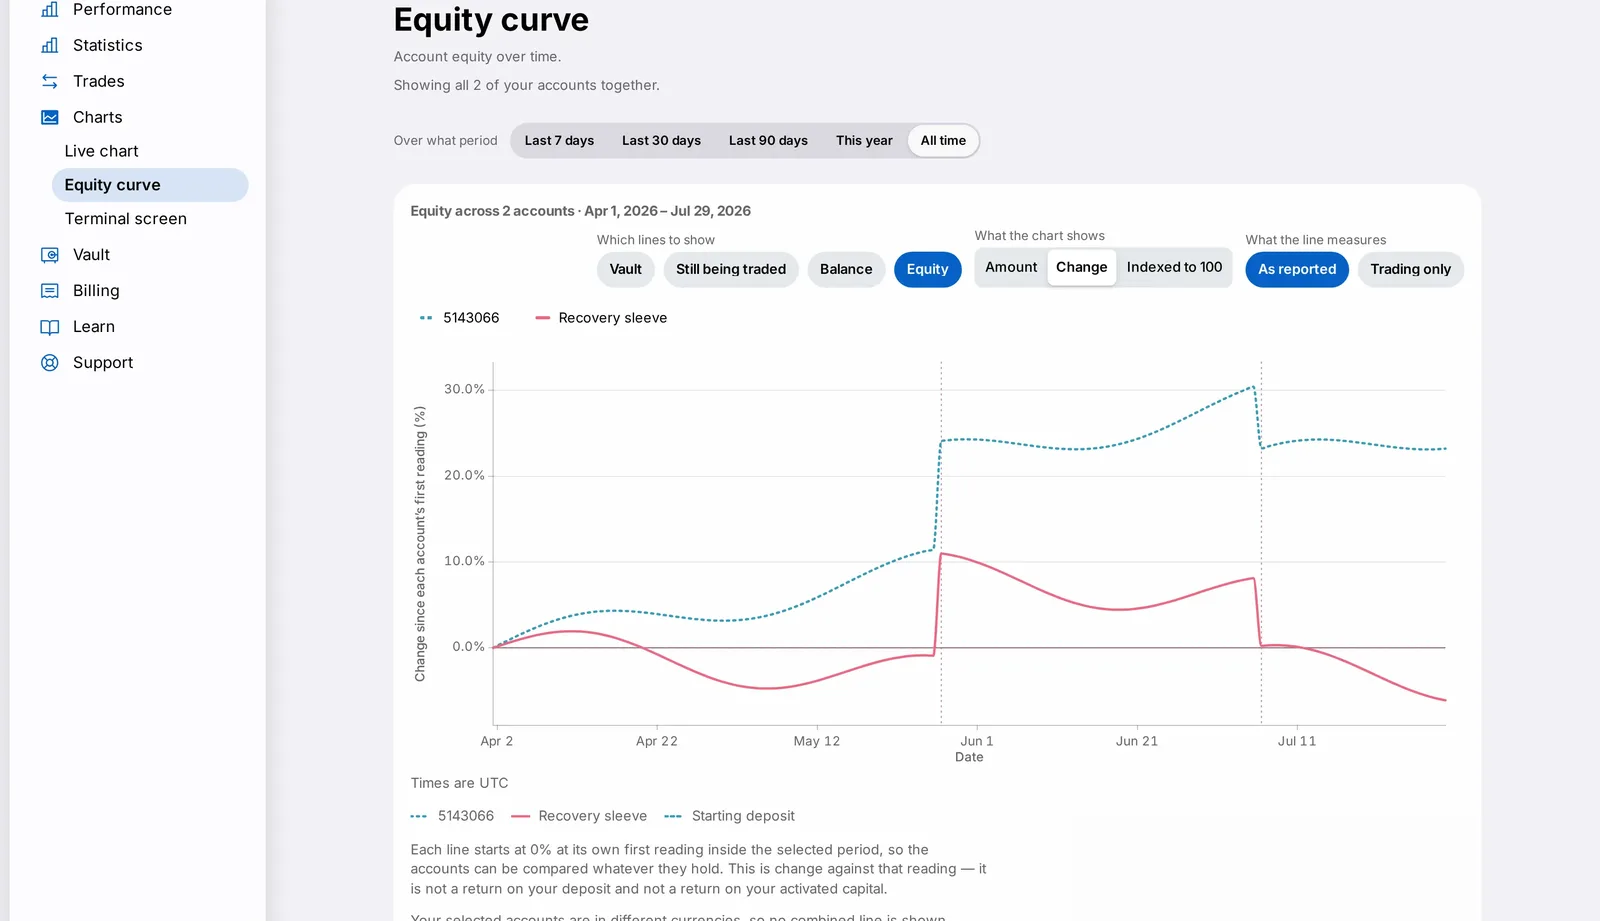
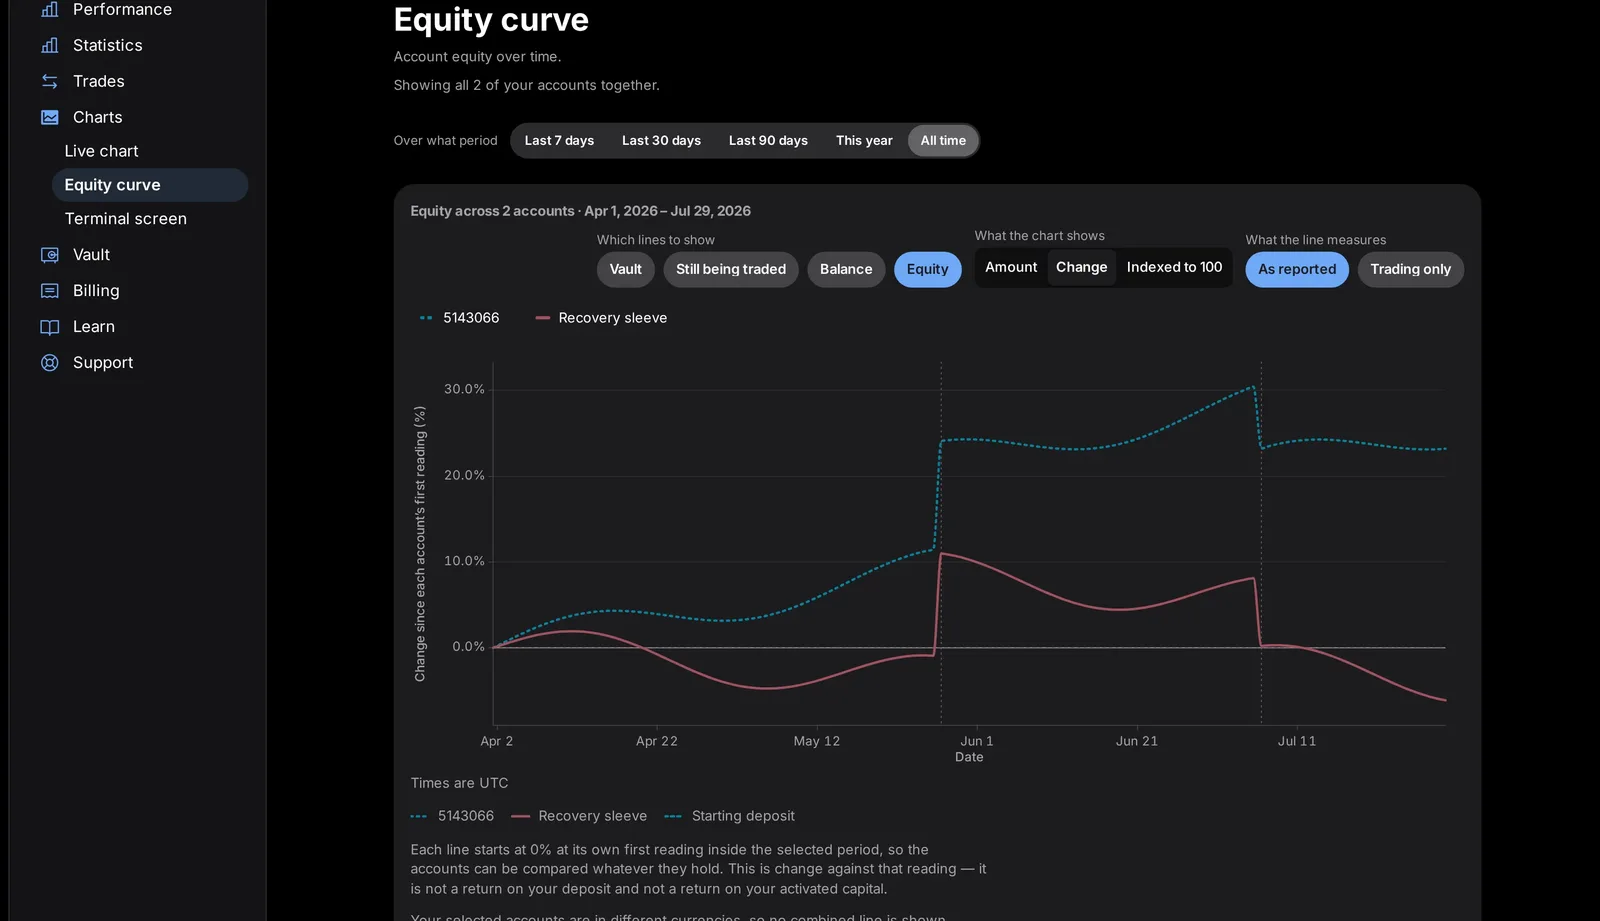
The large figure is your equity: your balance plus whatever any open position is worth at this moment. The range buttons (1D, 1W, 1M, 3M, 1Y, All) change how far back the curve underneath goes. Further down, "Your accounts, right now" prints each account's balance, which does not include open positions, so the two can differ by exactly your open profit or loss:
Floating P/L = Equity - Balance - Credit
If your accounts are held in more than one currency there is no single total, and Overview says so. Adding them up would need an exchange rate we do not publish, and inventing one would put a made-up number in the largest type on the page.
Today
Profit and loss made today, split into what is already settled (closed today) and what is still open (unrealised), followed by your open positions. These figures update on their own every few seconds.
Drawdown budget
This card answers one question: what can I still lose today? The software stops opening new positions when the budget is used up. It combines what you have already lost today with what is currently floating on open positions:
DD pool base   = the capital your daily loss limit is calculated from
Daily budget   = DD pool base x your drawdown percentage
Left today     = Daily budget - closed losses today - losses on open positions
A worked example, with made-up numbers: a pool base of 10,000 and a drawdown percentage of 15% gives a daily budget of 1,500. With 200 of closed losses and 150 floating on open positions, 1,150 is left. If the combined figure passes the budget, the card shows how far past today's loss limit the account is, and a "Budget used up" badge. The example is invented and describes no account; your own figures are on the card.
Daily growth cap
The daily growth cap is a profit-target stop. Once the day's gain on an account reaches that account's daily limit, the software stops opening new trades on it for the day. The card shows "Room left before today's cap" for each account and never adds the caps together, because two accounts have two separate limits. When an account reaches its cap its status reads Gated, and trading resumes at the next session. A losing day is not measured against this cap; losses are what the drawdown budget above is for. This cap counts every trade, including any you placed by hand, unlike the performance figures on the page.
Vault
"Protected in vault" is profit set aside so that it is no longer at risk in trading. It has its own card and a link to the vault. How the vault works is covered in the vault posts.
This week
One bar per day, plus week to date, per currency. "Recent form" appears once an account has enough completed trading days, and it fills in on its own. There is no combined recent form across accounts: a daily return is a percentage of each account's own capital, so averaging two of them would describe an account that does not exist.
Your accounts, right now
One row per account with its balance, margin used, free margin and a status: Trading, Gated (daily cap reached), Halted (for example a drawdown lock), Stopped, Market closed, or Unknown when CFIN cannot confirm. A rate is never averaged across accounts.
Why it matters
A page that shows several accounts has to decide what to do when their figures should not be combined. Overview keeps each currency, and each account's limits, separate, so every number on it can be traced back to one account. When CFIN cannot confirm a figure it says so, rather than showing a zero.
What you need to do
Nothing. If you have a bookmark to the old Overview page, it takes you to the current one. If you hold accounts in more than one currency, use the account picker to look at one account at a time. Figures shown are from your own accounts. Past performance is not a reliable indicator of future results.